

THESE are the nine areas of Southampton which have all recorded the highest Covid infection rates in the city, according to the Government's interactive map.
The Public Health England data shows that those areas all have infection rates of between 109 and 186.2 per 100,000 people. This means an average of one in 677 people in those areas has Covid-19.
The latest figures, which shows the data for the seven days to March 24, reveals that the areas are: Bevois Town, Central Southampton West, Highfield and University, Hightown, Redbridge and Millbrook West, Shirley Warren, Sholing East, St Denys, Thornhill.
Across the rest of the city, no other areas have rates of above 100 per 100,000 people.
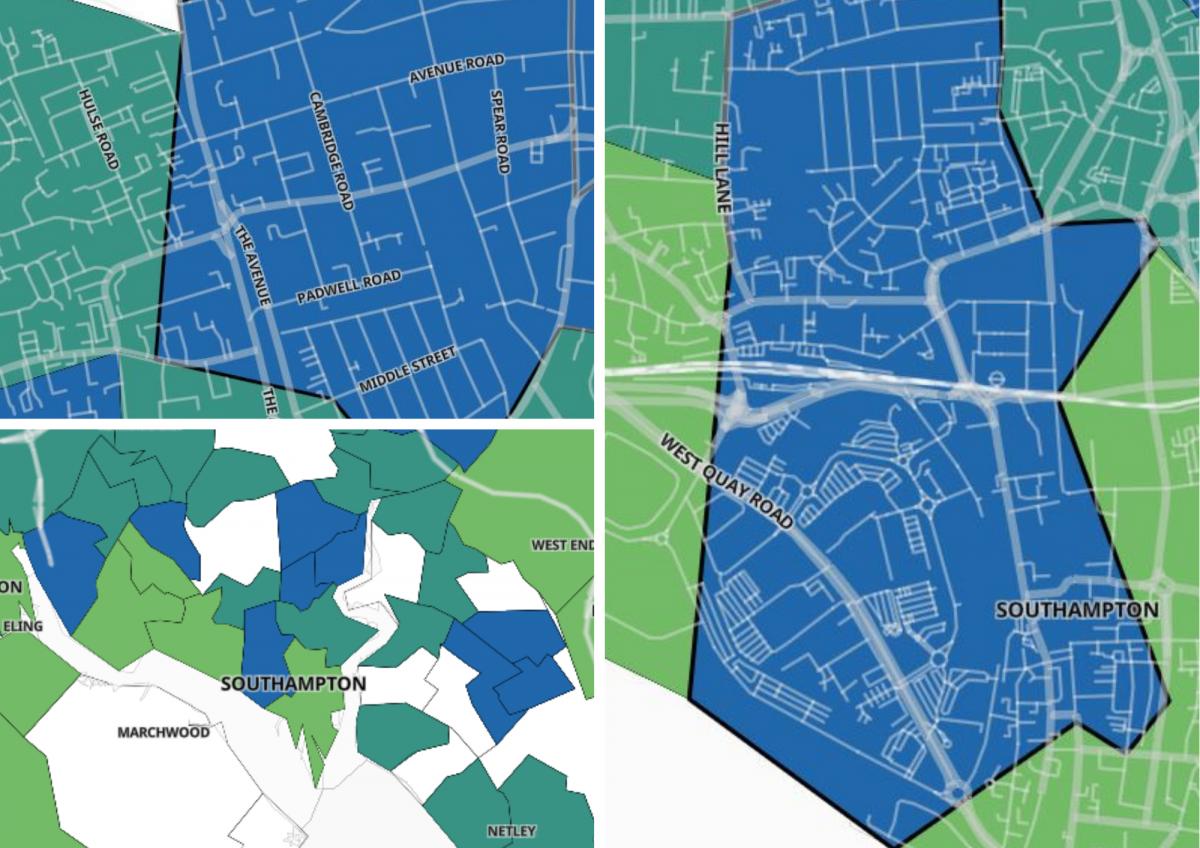
Below, we have detailed those areas which have the city's highest rates. On the maps, they are highlighted with a black border.
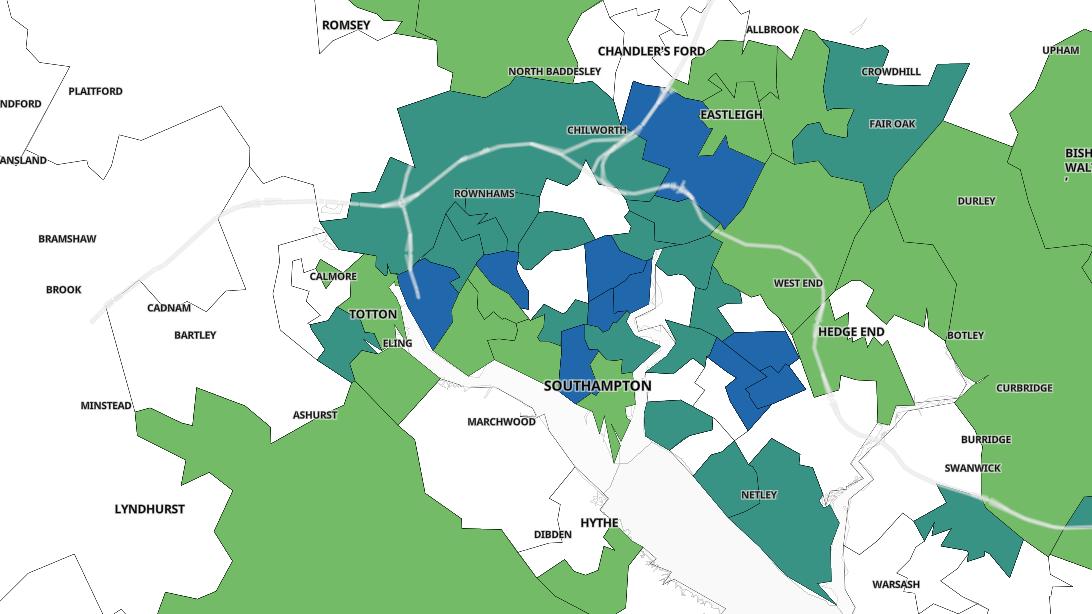
For reference, the map is divided into Middle Super Output Areas (MSOAs), which are areas with an average population of 7,200.
It then colour-codes MSOAs depending on their seven day rolling infection rate, with areas placed into the boundaries of 0-9 (yellow), 10-49 (light green), 50-99 (dark green), 100-199 (light blue), 200-399 (dark blue), 400 to 799 (light purple) and 800 plus (dark purple).
White areas are districts which have recorded fewer than three Covid cases in that time period.
Bevois Town
In the seven days to March 24, the area recorded 14 new cases, up 133.3% on the previous week.
This left it with an infection rate of 182 per 100,000 people, or one in every 537.

Central Southampton West
In the seven days to March 24, the area recorded 15 new cases, up 66.7% on the previous week.
This left it with an infection rate of 135 per 100,000 people, or one in every 741.

Highfield and University
In the seven days to March 24, the area recorded 9 new cases, up 12.5% on the previous week.
This left it with an infection rate of 126.3 per 100,000 people, or one in every 792.

Hightown
In the seven days to March 24, the area recorded 11 new cases, up 266.7% on the previous week.
This left it with an infection rate of 167 per 100,000 people, or one in every 599 .

Redbridge and Millbrook West
In the seven days to March 24, the area recorded 9 new cases, up 200% on the previous week.
This left it with an infection rate of 121 per 100,000 people, or one in every 826.

Shirley Warren
In the seven days to March 24, the area recorded 8 new cases, down 42.9% on the previous week.
This left it with an infection rate of 113.4 per 100,000 people, or one in every 882.

Sholing East
In the seven days to March 24, the area recorded 8 new cases, up 166.7% on the previous week.
This left it with an infection rate of 109 per 100,000 people, or one in every 917.

St Denys
In the seven days to March 24, the area recorded 10 new cases, up 66.7% on the previous week.
This left it with an infection rate of 116.5 per 100,000 people, or one in every 858.

Thornhill
In the seven days to March 24, the area recorded 10 new cases, up 150% on the previous week.
This left it with an infection rate of 132.7 per 100,000 people, or one in every 754.


Comments: Our rules
We want our comments to be a lively and valuable part of our community - a place where readers can debate and engage with the most important local issues. The ability to comment on our stories is a privilege, not a right, however, and that privilege may be withdrawn if it is abused or misused.
Please report any comments that break our rules.
Read the rules hereComments are closed on this article