

COVID is still on the rise in Southampton – with cases more than doubling in four districts.
The latest Government data shows that out of the 31 areas in the city, only nine reported a decrease in the seven days to September 28.
Two reported no change, and the remaining 20 reported an increase in cases when compared to the previous week.
Bitterne West had 42 cases, up 25 or 147%; Bitterne East had 49 cases, up 25 or 104.2%; Sholing West had 23 cases, up 15 or 187%; and Townhill Park reported 23 cases, up 12 or 109%.
Coxford and Lordshill reported the most drastic decrease in cases, going from 46 cases to 25 (45.7%).
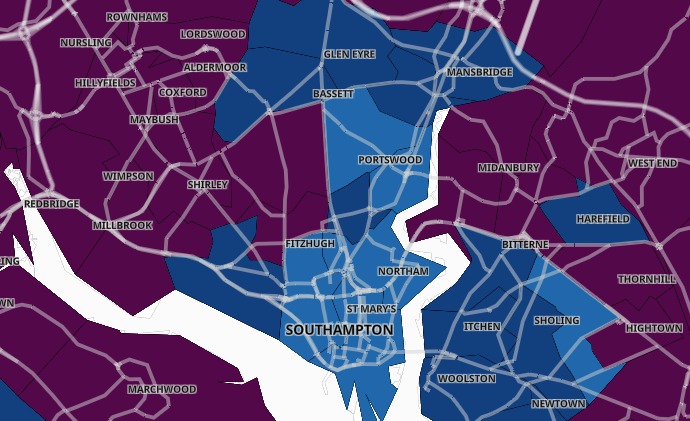
Southampton Covid map from the latest Government data
As a whole, Southampton had 891 cases, up 184 (26%), and a case rate of 352.4 per 100,000 people.
The county's case rate sits at 358.8 per 100,000 people.
Hampshire data does not include cases from Southampton or Portsmouth.
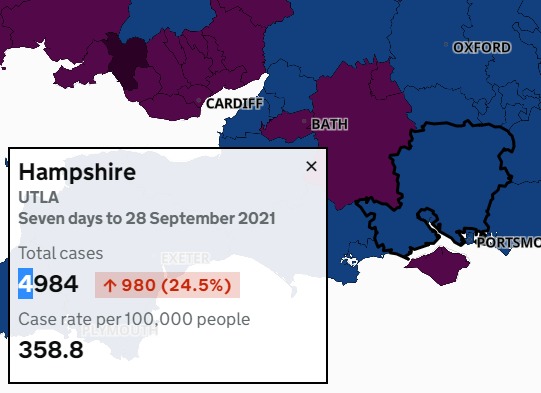
Hampshire Covid map from the latest Government data
Clusters are shown when there are three or more new cases reported at any one time.
Anywhere with between zero and two cases are shown in white in order to "protect the privacy of individuals and prevent disclosure", the Government organisation states.
- Read more: Government issue UK Covid travel update with 'red list' to be reduced
The latest data for the 31 Southampton districts:
- Aldermoor and Lordswood – 39 cases, up 6
- Banister Park and Howard Road – 38 cases, up 14
- Bassett Green – 25 cases, up 7
- Bevois Town – 15 cases, up 5
- Bitterne East – 49 cases, up 25
- Bitterne South – 19 cases, up 8
- Bitterne West – 42 cases, up 25
- Central Southampton East – 28 cases, down 13
- Central Southampton West – 20 cases, up 4
- Coxford and Lordshill – 25 cases, down 21
- Freemantle – 23 cases, down 1
- Harefield – 16 cases, up 4
- Highfield and University – 12 cases, no change
- Hightown – 13 cases, no change
- Hollybrook – 18 cases, down 1
- Itchen – 26 cases, up 12
- Maybush – 43 cases, up 20
- Newtown and Nicholstown – 24 cases, down 8
- Redbridge and Millbrook West – 32 cases, down 17
- Regents Park and Millbrook East – 38 cases, up 10
- Shirley South – 49 cases, up 14
- Shirley Warren – 36 cases, up 11
- Sholing East – 12 cases, down 3
- Sholing West – 23 cases, up 15
- St Denys – 16 cases, down 1
- Swaythling – 16 cases, down 8
- Thornhill – 44 cases, up 20
- Townhill Park – 23 cases, up 11
- Weston – 19 cases, up 8
- Woolston – 25 cases, up 8
- Upper Shirley – 42 cases, up 4


Comments: Our rules
We want our comments to be a lively and valuable part of our community - a place where readers can debate and engage with the most important local issues. The ability to comment on our stories is a privilege, not a right, however, and that privilege may be withdrawn if it is abused or misused.
Please report any comments that break our rules.
Read the rules hereComments are closed on this article