

COVID is beginning to ease in Southampton – but some districts are still reporting a drastic increase in case numbers.
For the first time in months, more than 10 areas have seen a decrease.
This is shown in the latest Government data available, which compares the numbers in the seven days to October 6 to the week before.
In this period, 11 districts reported a decrease, 19 an increase, and one no change.
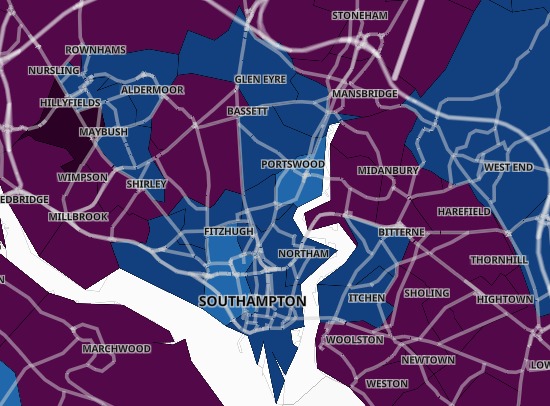
Coronavirus in Southampton: mapped
Maybush now sits in the highest category possible due to its case rate of 817 per 100,000 people. It appears dark maroon on the map for this reason.
Harefield saw its cases more than double to 49 (up 29 or 145%); and Sholing East the same to 36 cases (up 20 or 125%).
As a whole, Southampton reported 1,073 cases, up 116 or 12.1%. This is a case rate of 424.3 per 100,000 people.
Hampshire reported 5,490, an increase of 382 or 7.5% – increasing the case rate to 395.2 per 100,000 people.
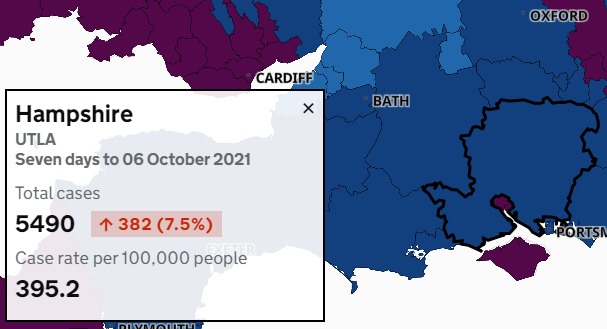
Coronavirus in Hampshire mapped
County data does not include cases from Southampton or Portsmouth.
Clusters are shown when there are three or more new cases reported at any one time.
Anywhere with between zero and two cases are shown in white in order to "protect the privacy of individuals and prevent disclosure", the Government organisation states.
The latest data for the 31 Southampton districts:
- Aldermoor and Lordswood – 30 cases, down 15
- Banister Park and Howard Road – 25 cases, down 7
- Bassett Green – 25 cases, up 1
- Bevois Town – 16 cases, up 2
- Bitterne East – 33 cases, down 18
- Bitterne South – 23 cases, up 4
- Bitterne West – 38 cases, down 11
- Central Southampton East – 33 cases, no change
- Central Southampton West – 17 cases, down 6
- Coxford and Lordshill – 18 cases, down 3
- Freemantle – 26 cases, down 7
- Harefield – 49 cases, up 29
- Highfield and University – 16 cases, up 3
- Hightown – 34 cases, up 10
- Hollybrook – 25 cases, up 7
- Itchen – 32 cases, up 1
- Maybush – 67 cases, up 20
- Newtown and Nicholstown – 39 cases, up 7
- Redbridge and Millbrook West – 42 cases, down 2
- Regents Park and Millbrook East – 51 cases, up 18
- Shirley South – 49 cases, down 7
- Shirley Warren – 28 cases, down 10
- Sholing East – 36 cases, up 20
- Sholing West – 29 cases, up 4
- St Denys – 39 cases, up 17
- Swaythling – 30 cases, up 12
- Thornhill – 51 cases, up 2
- Townhill Park – 26 cases, down 5
- Weston – 33 cases, up 14
- Woolston – 48 cases, up 22
- Upper Shirley – 49 cases, up 6


Comments: Our rules
We want our comments to be a lively and valuable part of our community - a place where readers can debate and engage with the most important local issues. The ability to comment on our stories is a privilege, not a right, however, and that privilege may be withdrawn if it is abused or misused.
Please report any comments that break our rules.
Read the rules hereLast Updated:
Report this comment Cancel