

THIS map shows how each Southampton district is faring in terms of Covid cases.
It uses Government data to compare reported case numbers in the seven days to November 5 to the figures from the previous week.
This is the latest data available, and 10 districts reported an increase. The other 21 saw a decrease.
More areas are beginning to turn blue on the map, meaning they have a case rate of fewer than 399 per 100,000 people.
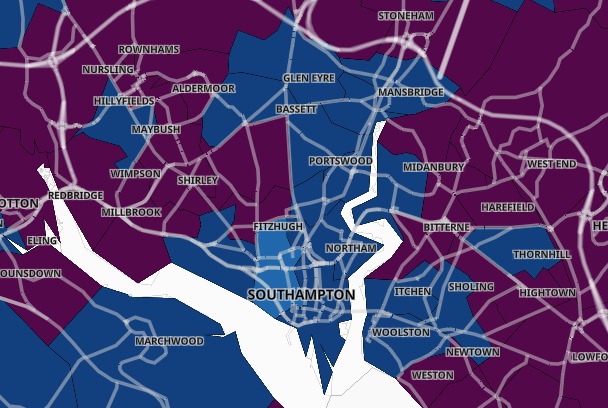
The latest Covid map using Government data for Southampton
As a whole, Southampton reported 1,037 cases, down 137 or 11.7%. This is a case rate of 410.1 per 100,000 people.
Hampshire reported 5,932, a decrease of 1,688 or 22.2% – meaning the case rate sits at 427 per 100,000 people.
County data does not include cases from Southampton or Portsmouth.
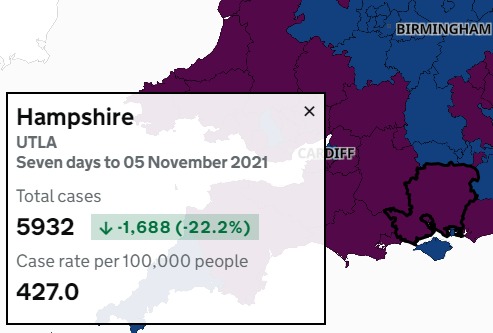
The latest Covid map using Government data for Hampshire
Clusters are shown when there are three or more new cases reported at any one time.
Anywhere with between zero and two cases are shown in white in order to "protect the privacy of individuals and prevent disclosure", the Government organisation states.
The latest data for the 31 Southampton districts:
- Aldermoor and Lordswood – 31 cases, down 6
- Banister Park and Howard Road – 41 cases, down 1
- Bassett Green – 25 cases, down 23
- Bevois Town – 19 cases, down 1
- Bitterne East – 48 cases, up 1
- Bitterne South – 32 cases, down 11
- Bitterne West – 32 cases, down 14
- Central Southampton East – 46 cases, up 5
- Central Southampton West – 20 cases, down 4
- Coxford and Lordshill – 27 cases, down 9
- Freemantle – 30 cases, down 4
- Harefield – 25 cases, down 13
- Highfield and University – 20 cases, down 3
- Hightown – 45 cases, up 14
- Hollybrook – 20 cases, down 4
- Itchen – 27 cases, down 23
- Maybush – 29 cases, down 11
- Newtown and Nicholstown – 41 cases, up 11
- Redbridge and Millbrook West – 31 cases, up 5
- Regents Park and Millbrook East – 42 cases, up 3
- Shirley South – 45 cases, up 14
- Shirley Warren – 34 cases, down 4
- Sholing East – 39 cases, up 5
- Sholing West – 23 cases, down 3
- St Denys – 20 cases, down 12
- Swaythling – 18 cases, down 10
- Thornhill – 30 cases, down 17
- Townhill Park – 38 cases, up 10
- Weston – 48 cases, up 11
- Woolston – 34 cases, down 21
- Upper Shirley – 55 cases, down 11


Comments: Our rules
We want our comments to be a lively and valuable part of our community - a place where readers can debate and engage with the most important local issues. The ability to comment on our stories is a privilege, not a right, however, and that privilege may be withdrawn if it is abused or misused.
Please report any comments that break our rules.
Read the rules hereLast Updated:
Report this comment Cancel