

AN AREA of Southampton has one of the worst Covid rates in the country.
The Government considers areas with case rates higher than 800 per 100,000 people to be in the worst category possible.
Townhill Park reported a rate of 1,032 in the seven days to November 19 – the latest data available. This is higher than any London borough, and almost every district in the country.
It experienced an increase of 35 cases when compared to the week prior.
Shirley South and Bitterne East are also in the worst category, meaning they appear a dark maroon on the Government map.
Central Southampton West experienced a huge decrease in cases in the same period (14 cases, down 19).
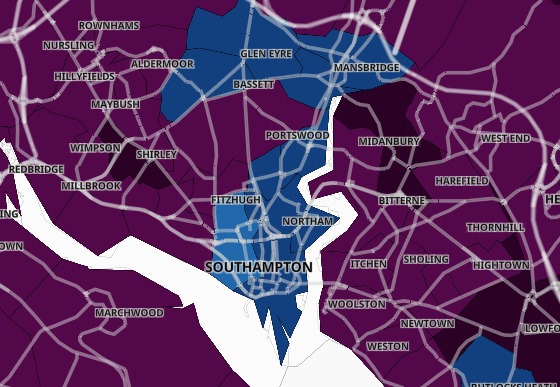
The latest Covid map for Southampton
Of the 31 city districts, 25 reported an increase in case numbers and six a decrease.
As a whole, Southampton reported 1,357 cases, up 314 or 30.1%. This is a case rate of 536.6 per 100,000 people.
Hampshire reported 7,385, an increase of 1,181 or 19% – increasing the case rate to 531.6 per 100,000 people.
County data does not include cases from Southampton or Portsmouth.
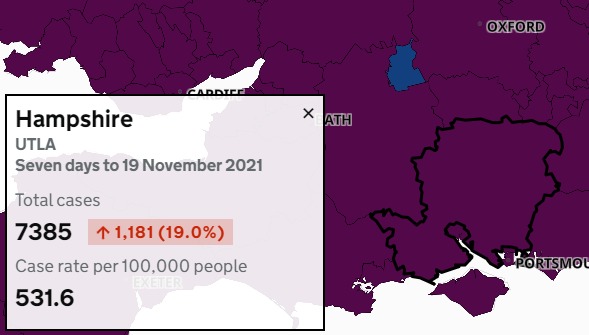
The latest Covid map for Hampshire
Clusters are shown when there are three or more new cases reported at any one time.
Anywhere with between zero and two cases are shown in white in order to "protect the privacy of individuals and prevent disclosure", the Government organisation states.
The latest data for the 31 Southampton districts:
Aldermoor and Lordswood – 34 cases, down 4
Banister Park and Howard Road – 38 cases, up 13
Bassett Green – 24 cases, up 13
Bevois Town – 16 cases, up 2
Bitterne East – 66 cases, up 22
Bitterne South – 45 cases, up 16
Bitterne West – 57 cases, up 11
Central Southampton East – 52 cases, up 10
Central Southampton West – 14 cases, down 19
Coxford and Lordshill – 28 cases, down 4
Freemantle – 37 cases, up 4
Harefield – 41 cases, up 13
Highfield and University – 35 cases, up 16
Hightown – 51 cases, up 18
Hollybrook – 20 cases, up 7
Itchen – 59 cases, up 22
Maybush – 60 cases, up 28
Newtown and Nicholstown – 40 cases, up 17
Redbridge and Millbrook West – 38 cases, up 9
Regents Park and Millbrook East – 57 cases, up 5
Shirley South – 67 cases, up 21
Shirley Warren – 52 cases, up 14
Sholing East – 42 cases, down 2
Sholing West – 40 cases, up 12
St Denys – 25 cases, down 2
Swaythling – 25 cases, down 2
Thornhill – 54 cases, up 3
Townhill Park – 59 cases, up 35
Weston – 42 cases, up 2
Woolston – 65 cases, up 6
Upper Shirley – 51 cases, up 17


Comments: Our rules
We want our comments to be a lively and valuable part of our community - a place where readers can debate and engage with the most important local issues. The ability to comment on our stories is a privilege, not a right, however, and that privilege may be withdrawn if it is abused or misused.
Please report any comments that break our rules.
Read the rules hereComments are closed on this article