

COVID case numbers in Southampton are currently a real mixed bag – with no trend emerging from Government data.
In the seven days to November 27, 14 of the city's districts reported an increase in case numbers when compared to the week before.
This data, the latest available, also shows that 17 districts reported a decrease.
Cases nearly halved in Bitterne East and now sit at 33, down 18. But Townhill Park still has one of the worst case rates in the country, of 1,032.6 per 100,000 people.
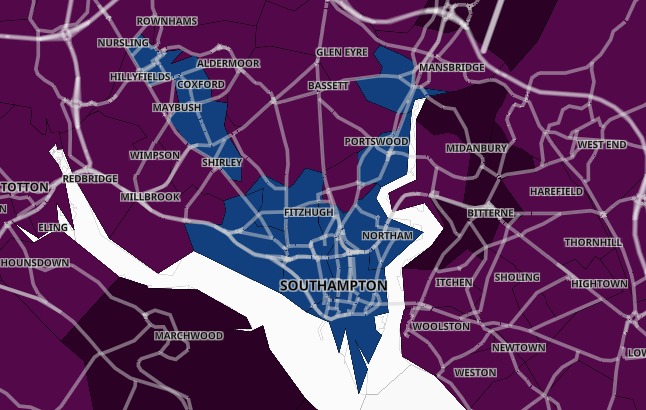
The latest Covid map for Southampton using Government data
However, as a whole, cases in Southampton are still on the decline.
The city reported 1,254 cases in the same period, down 79 or 5.9%. This is a case rate of 495.9 per 100,000 people.
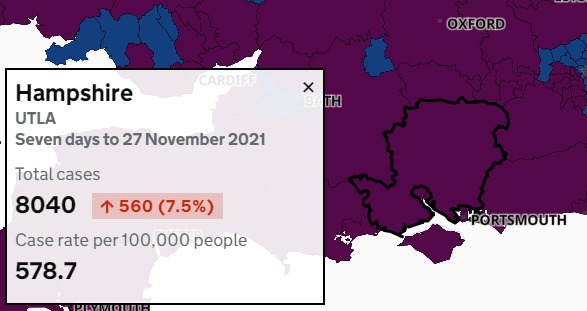
Hampshire reported 8,040, an increase of 560 or 7.5% – increasing the case rate to 578.8 per 100,000 people.
County data does not include cases from Southampton or Portsmouth.
The latest Covid map for Southampton using Government data
Clusters are shown when there are three or more new cases reported at any one time.
Anywhere with between zero and two cases are shown in white in order to "protect the privacy of individuals and prevent disclosure", the Government organisation states.
The latest data for the 31 Southampton districts:
- Aldermoor and Lordswood – 38 cases, up 2
- Banister Park and Howard Road – 23 cases, up 11
- Bassett Green – 40 cases, up 15
- Bevois Town – 33 cases, up 16
- Bitterne East – 71 cases, up 13
- Bitterne South – 51 cases, up 15
- Bitterne West – 50 cases, down 11
- Central Southampton East – 50 cases, up 1
- Central Southampton West – 23 cases, up 11
- Coxford and Lordshill – 21 cases, down 8
- Freemantle – 17 cases, down 16
- Harefield – 38 cases, down 3
- Highfield and University – 30 cases, down 5
- Hightown – 48 cases, up 1
- Hollybrook – 27 cases, up 10
- Itchen – 43 cases, down 15
- Maybush – 45 cases, down 18
- Newtown and Nicholstown – 40 cases, down 5
- Redbridge and Millbrook West – 30 cases, down 8
- Regents Park and Millbrook East – 58 cases, up 1
- Shirley South – 45 cases, down 21
- Shirley Warren – 26 cases, down 21
- Sholing East – 49 cases, up 6
- Sholing West – 35 cases, down 7
- St Denys – 23 cases, down 2
- Swaythling – 18 cases, down 7
- Thornhill – 41 cases, down 5
- Townhill Park – 59 cases, up 4
- Weston – 40 cases, down 4
- Woolston – 66 cases, up 2
- Upper Shirley – 43 cases, down 3


Comments: Our rules
We want our comments to be a lively and valuable part of our community - a place where readers can debate and engage with the most important local issues. The ability to comment on our stories is a privilege, not a right, however, and that privilege may be withdrawn if it is abused or misused.
Please report any comments that break our rules.
Read the rules hereComments are closed on this article