

COVID continues to spread across Southampton neighbourhoods as schools and workplaces return from the festive break.
In the seven days to December 29, the city saw 508 more cases when compared to the previous week, according to the latest Government data.
This means the total number of cases sits at 3,196 – a case rate of 1,263.9 per 100,000 people.
However, eight of the city's 31 districts reported a decrease in cases during the same period.
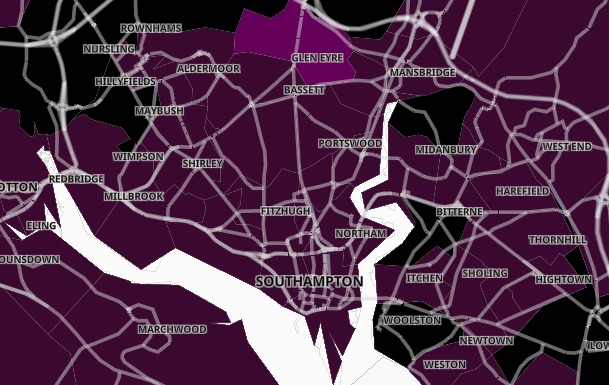
The latest Covid data mapped for Southampton
Although case rates are very high across most of these districts, this is the most number of decreases since October.
22 of the remaining districts reported an increase in cases, and one no change.
Hampshire reported 17,768, an increase of 3,684 or 26.2% – increasing the case rate to 1,279 per 100,000 people.
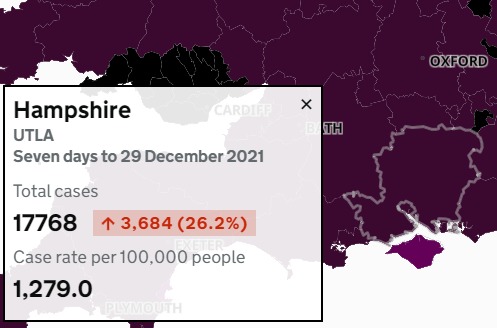
The latest Covid data mapped for Hampshire
County data does not include cases from Southampton or Portsmouth.
Clusters are shown when there are three or more new cases reported at any one time.
Anywhere with between zero and two cases are shown in white in order to "protect the privacy of individuals and prevent disclosure", the Government organisation states.
The latest data for the 31 Southampton districts:
- Aldermoor and Lordswood – 100 cases, up 12
- Banister Park and Howard Road – 121 cases, up 12
- Bassett Green – 57 cases, down 20
- Bevois Town – 78 cases, down 1
- Bitterne East – 113 cases, up 31
- Bitterne South – 98 cases, up 34
- Bitterne West – 118 cases, up 36
- Central Southampton East – 213 cases, up 22
- Central Southampton West – 127 cases, down 11
- Coxford and Lordshill – 78 cases, up 6
- Freemantle – 112 cases, up 38
- Harefield – 73 cases, up 12
- Highfield and University – 56 cases, down 29
- Hightown – 70 cases, up 10
- Hollybrook – 66 cases, no change
- Itchen – 98 cases, up 5
- Maybush – 132 cases, up 59
- Newtown and Nicholstown – 137 cases, up 42
- Redbridge and Millbrook West – 93 cases, up 40
- Regents Park and Millbrook East – 103 cases, up 24
- Shirley South – 104 cases, up 30
- Shirley Warren – 97 cases, up 36
- Sholing East – 109 cases, up 23
- Sholing West – 85 cases, up 23
- St Denys – 77 cases, down 13
- Swaythling – 79 cases, down 6
- Thornhill – 86 cases, down 1
- Townhill Park – 93 cases, up 22
- Weston – 85 cases, up 35
- Woolston – 161 cases, up 44
- Upper Shirley – 103 cases, down 4


Comments: Our rules
We want our comments to be a lively and valuable part of our community - a place where readers can debate and engage with the most important local issues. The ability to comment on our stories is a privilege, not a right, however, and that privilege may be withdrawn if it is abused or misused.
Please report any comments that break our rules.
Read the rules hereComments are closed on this article