

COVID cases are still rising in most Southampton neighbourhoods.
In the seven days to December 31, 26 of the 31 districts reported an increase when compared to the previous week.
This is the latest Government data availabe – and also shows that just five districts saw a decrease.
Case rates are exceptionally high in Woolston, where 1,898 people per 100,000 have tested positive. This is higher than most London boroughs.
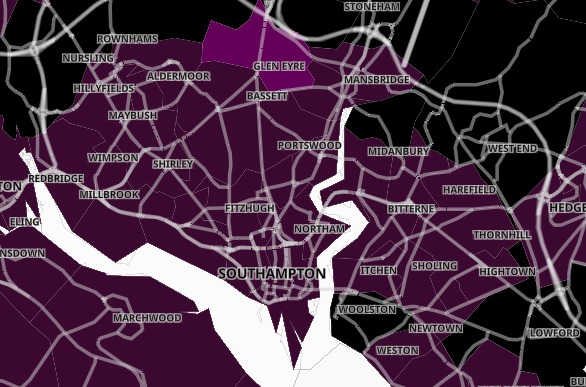
Covid data mapped for Southampton
Townhill Park also has a high rate of 1,645.1 per 100,000 people.
However, Bassett Green continues to buck the trend, with a case rate of just 625.6. This is by far the lowest in Southampton, hence why it is the only district to appear a lighter purple.
As a whole, Southampton reported 3,330 cases, up 465 or 16.2%. This is a case rate of 1,316.9 per 100,000 people.
Hampshire reported 18,929, an increase of 3,548 or 23.1% – increasing the case rate to 1,362.6 per 100,000 people.
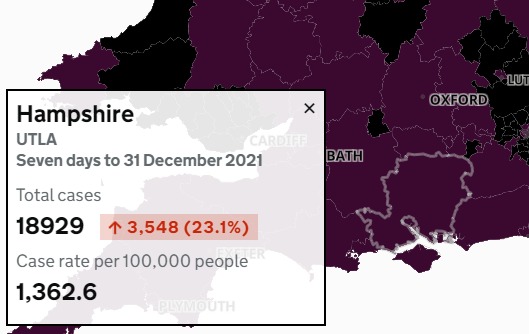
Covid data mapped for Hampshire
County data does not include cases from Southampton or Portsmouth.
Clusters are shown when there are three or more new cases reported at any one time.
Anywhere with between zero and two cases are shown in white in order to "protect the privacy of individuals and prevent disclosure", the Government organisation states.
The latest data for the 31 Southampton districts:
Aldermoor and Lordswood – 108 cases, up 13
Banister Park and Howard Road – 118 cases, up 3
Bassett Green – 58 cases, down 14
Bevois Town – 87 cases, up 9
Bitterne East – 104 cases, down 8
Bitterne South – 96 cases, up 24
Bitterne West – 107 cases, up 5
Central Southampton East – 203 cases, down 2
Central Southampton West – 145 cases, up 6
Coxford and Lordshill – 86 cases, up 4
Freemantle – 110 cases, up 25
Harefield – 82 cases, up 10
Highfield and University – 70 cases, up 11
Hightown – 73 cases, up 3
Hollybrook – 66 cases, down 7
Itchen – 118 cases, up 19
Maybush – 124 cases, up 31
Newtown and Nicholstown – 142 cases, up 25
Redbridge and Millbrook West – 100 cases, up 48
Regents Park and Millbrook East – 110 cases, up 23
Shirley South – 115 cases, up 32
Shirley Warren – 105 cases, up 37
Sholing East – 108 cases, up 15
Sholing West – 88 cases, up 19
St Denys – 86 cases, up 9
Swaythling – 96 cases, up 16
Thornhill – 88 cases, down 2
Townhill Park – 94 cases, up 16
Weston – 81 cases, up 22
Woolston – 174 cases, up 55
Upper Shirley – 115 cases, up 15


Comments: Our rules
We want our comments to be a lively and valuable part of our community - a place where readers can debate and engage with the most important local issues. The ability to comment on our stories is a privilege, not a right, however, and that privilege may be withdrawn if it is abused or misused.
Please report any comments that break our rules.
Read the rules hereComments are closed on this article