

COVID is on the decline in the majority of Southampton districts for the first time in months.
Out of the 31 neighbourhoods, 19 reported a decrease in the seven days to January 8.
This was when compared to the previous week and is the latest Government data available.
The remaining 12 reported an increase over the same period.
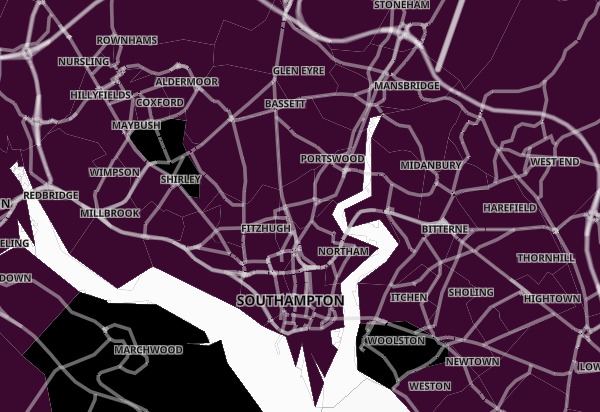
The latest Covid map for Southampton
Just two of the districts now sit in the highest possible case rate category, and have over 1,600 cases per 100,000 people.
These are Shirley Warren (2,007.1) and Woolston (1920.8).
As a whole, Southampton reported 3,305 cases, down 180 or 5.2%. This is a case rate of 1,307 per 100,000 people.
Hampshire reported 18,324, a decrease of 1,480 or 7.5% – increasing the case rate to 1,319 per 100,000 people.
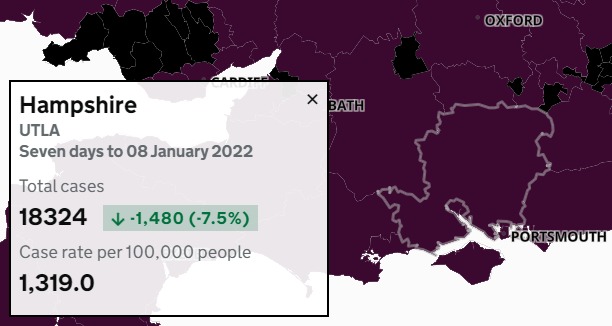
The latest Covid map for Hampshire
County data does not include cases from Southampton or Portsmouth.
Clusters are shown when there are three or more new cases reported at any one time.
Anywhere with between zero and two cases are shown in white in order to "protect the privacy of individuals and prevent disclosure", the Government organisation states.
The latest data for the 31 Southampton districts:
- Aldermoor and Lordswood – 104 cases, down 21
- Banister Park and Howard Road – 109 cases, down 11
- Bassett Green – 75 cases, up 13
- Bevois Town – 96 cases, up 12
- Bitterne East – 77 cases, down 34
- Bitterne South – 86 cases, down 12
- Bitterne West – 104 cases, down 9
- Central Southampton East – 228 cases, up 13
- Central Southampton West – 134 cases, down 10
- Coxford and Lordshill – 93 cases, up 2
- Freemantle – 117 cases, up 4
- Harefield – 82 cases, down 14
- Highfield and University – 56 cases, down 16
- Hightown – 95 cases, up 16
- Hollybrook – 66 cases, down 6
- Itchen – 113 cases, up 18
- Maybush – 125 cases, up 1
- Newtown and Nicholstown – 136 cases, down 13
- Redbridge and Millbrook West – 93 cases, down 12
- Regents Park and Millbrook East – 105 cases, down 10
- Shirley South – 97 cases, down 23
- Shirley Warren – 142 cases, up 31
- Sholing East – 105 cases, down 12
- Sholing West – 93 cases, down 3
- St Denys – 93 cases, up 5
- Swaythling – 77 cases, down 22
- Thornhill – 113 cases, up 12
- Townhill Park – 80 cases, down 21
- Weston – 66 cases, down 13
- Woolston – 176 cases, up 1
- Upper Shirley – 103 cases, down 7


Comments: Our rules
We want our comments to be a lively and valuable part of our community - a place where readers can debate and engage with the most important local issues. The ability to comment on our stories is a privilege, not a right, however, and that privilege may be withdrawn if it is abused or misused.
Please report any comments that break our rules.
Read the rules hereComments are closed on this article